Market report for week to Saturday, 13 October: Storms, blackouts; Five days of spikes push Qld average price up 134pc, with Vic and Tas rising 1-11pc, SA steady and NSW down 5pc to overall $32.67-$111.53/MWh range on firmer demand
Posted by electricityweek on October 15, 2007
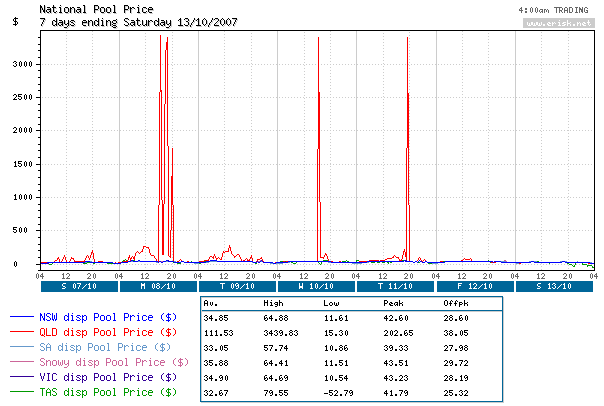 Severe storms in south-eastern Queensland for most of the week resulted in spikes from Sunday to Thursday, with top prices exceeding $3000 on Monday, Wednesday and Thursday. Queensland’s average price jumped 134 per cent while Victoria and Tasmania rose 1-11 per cent, South Australia dipped 14 cents and NSW fell 5 per cent to an overall range of $32.67-$111.53/MWh. System-wide maximum demand was up 182MW (0.7 per cent) to 27,570MW, with rises in Victoria, South Australia and Queensland and falls in NSW and Tasmania.
Top (half-hour) price of the week was the $3439.83/MWh in Queensland for the 30-minute trading interval ended 1700EST Monday. Queensland had the highest average price of the week and Tasmania, which had negative prices on both Sunday and Saturday, the lowest.
Brisbane’s 31 degrees highest of NEM capitals: A top temperature of 31 degrees on Friday in Brisbane was the highest for the week in the NEM capitals. Temperature ranges for the NEM capitals were: Sydney minimums between 11-17 degrees (12-19 the previous week) and top temperatures between 19-25 degrees (23-25); Melbourne minimums between 6-16 degrees (9-15) and tops between 16-25 degrees (16-23); Adelaide minimums between 7-17 degrees (8-13) and tops between 17-30 degrees (18-31); Brisbane minimums between 18-21 degrees (14-19) and tops between 23-31 degrees (28-34); and Hobart minimums between 5-11 degrees (5-10) and tops between 14-23 degrees (13-16).
Major events of week: Queensland grabbed the spotlight this week with spikes on the first five days of the week making eight successive days of spikes. Stormy weather in south-eastern Queensland with lightning resulting in credible contingencies being declared for transmission lines every day from Monday to Friday; directions being issued to three participants on Wednesday to maintain power system security; $10,000 overconstrained energy prices in Queensland on Monday, Wednesday and Thursday; and negative settlement residues exceeding the QNI interconnector threshold on Monday, Wednesday and Thursday. In addition the NSW to Queensland Terranora interconnector was constrained twice on Tuesday morning to manage post-contingent flows. On Tuesday, control system problems resulted in the easterly flow of the Victoria-South Australia Murraylink interconnector being cut to 47MW from 1450EST to 1525EST. On Saturday, NEMMCO opened the Eildon power station to Mount Beauty terminal station No. 1 and No. 2 220kV transmission lines and invoked a constraint to maintain voltage limits to a secure limit following an unplanned outage of the Eildon to Thomastown 220kV transmission line. NEMMCO made 42 declarations during the week of non-conformity for scheduled power stations relating to rebids not received – 4 in NSW, 2 in Victoria, 11 in South Australia, 20 in Queensland and 5 in Tasmania.
Week in detail:
• NSW: Average price $34.85/MWh, down 5 per cent on the $36.62/MWh the previous week, up 19 per cent on the $29.32/MWh of the comparable week last year; maximum price $64.88/MWh for the 30-minute trading interval ended 1900EST Monday. Average demand 8425MW, up 0.8 per cent on the previous week, down 2.0 per cent on a year ago; maximum demand 10,234MW in the 1430EST Thursday interval, down 3.1 per cent on the 10,557MW the previous week.
• Victoria: Average price $34.90/MWh, up 1 per cent on the $34.52/MWh the previous week, up 11 per cent on the $31.45/MWh of the comparable week last year; maximum price $64.69/MWh for the 30-minute trading interval ended 1900EST Monday. Average demand 5862MW, up 1.9 per cent on the previous week, also up 1.9 per cent on a year ago; maximum demand 6813MW for the 1930EST Monday interval, up 2.4 per cent on the 6656MW the previous week.
• South Australia: Average price $33.05/MWh, down 14 cents on the $33.19/MWh the previous week, up 3 per cent on the $32.04/MWh of the comparable week last year, maximum price $57.74/MWh for the 30-minute trading interval ended 1900EST Thursday. Average demand 1419MW, up 8.3 per cent on the previous week, exactly the same as a year ago; maximum demand 1718MW in the 2000EST Monday interval, up 3.9 per cent on the 1653MW the previous week.
• Queensland: Average price $111.53/MWh, up 134 per cent on the spike-affected $47.68/MWh the previous week, up 401 per cent on the $22.24/MWh of the comparable week last year; maximum price $3439.83/MWh for the 30-minute trading interval ended 1700EST Monday. Average demand 5771MW, up 2.6 per cent on the previous week, up 3.5 per cent on a year ago; maximum demand 7272MW for the 1430EST Friday interval, up 4.7 per cent on the 6948MW the previous week.
• Tasmania: Average price $32.67/MWh, up 11 per cent on the negative price-affected $29.55/MWh average the previous week, down 3 per cent on the $33.60/MWh of the comparable week last year; maximum price $79.55/MWh for the 30-minute trading interval ended 0630EST Monday. There were also negative prices with a high of minus $7.65/MWh in the 0800EST Sunday, 7 October interval and in the 0400EST interval on Sunday, 14 October, the last interval of the trading week. Average demand 1161MW, down 3.8 per cent on the previous week, up 4.2 per cent on a year ago; maximum demand 1473MW for the 0700EST Wednesday interval, down 1.5 per cent on the 1496MW the previous week.
One back, three off in NSW: The 660MW capacity Eraring 2 came back online in the 1800EST Wednesday interval. The 500MW capacity Liddell 1 went offline in the 1800EST Friday interval. The 500MW capacity Wallerawang C8 quit in the 2230EST Thursday interval. The 150MW capacity Redbank 1 retired in the 2200EST Friday interval. The 500MW capacity Liddell 4, the 660MW capacity Vales Point B5 and the 300MW Munmorah 3 remained idle all week.
One back, one off in Vic: The 200MW capacity Hazelwood 7 came back online in the 0430EST Friday interval. The 500MW capacity Loy Yang A3 went offline in the 0900EST Friday interval. The 200MW capacity Hazelwood 5 and the 500MW capacity Newport were off all week. The two West Kiewa units, the two Bairnsdale units, the two Eildon units, the two McKay units, Valley Power, Laverton North and Somerton operated at various times during the week.
One back, one off in SA: The 200MW capacity Torrens Island B2 went offline in the 1630EST Saturday interval. The 120MW capacity Torrens Island A2 returned in 1200EST Friday interval. The 200MW capacity Torrens Island B3 was offline in the intervals between 0030-0630EST Friday. The 120MW capacity Torrens Island A1 operated in the intervals between 2300EST Wednesday and 1700EST Friday. The 120MW capacity Torrens Island A3 operated between 13320EST Sunday and 0400EST Wednesday and again between 0530EST Wednesday and 0030EST Friday. The 40MW capacity Ladbroke Grove 1, the 40MW capacity Ladbroke Grove 2, the 200MW capacity Torrens Island B2, the 120MW capacity Torrens Island B4 and the 120MW capacity Torrens Island A4 were offline all week.
Four back, two off in Qld: The 750MW capacity Kogan Creek came back on the grid in the 1300EST Monday interval. The 443MW capacity Tarong North returned in the 0430EST Friday interval. The 125MW capacity Swanbank B2 resumed in the 1600EST Saturday interval. The 32MW capacity Collinsville 2 returned in the 0430EST Monday interval. The 125MW capacity Swanbank B4 went off the grid in the 2230EST Saturday interval. The 66MW capacity Collinsville 5 quit in the 2130EST Friday interval. The 426MW capacity Millmerran 2 operated in the intervals between 0030EST Wednesday and 0600EST Thursday. The 420MW capacity Callide 4 was offline in the intervals between 2330EST Monday and 0000EST Wednesday and again between 1130EST Wednesday and 1830EST Thursday. The 55MW capacity Barcaldine operated at various times each week day. The 350MW capacity Tarong 4, the 350MW capacity Callide B1, the 280MW capacity Gladstone 5 and the 280MW capacity Gladstone 6 were off the grid all week.
One back, four off in Tas: The 120MW capacity Bell Bay 1 came back online in the 1230EST Saturday interval. The 85MW capacity Cethana returned in the 0030EST interval, then operated at various times later on Thursday and on Friday and Saturday. The 82.8MW capacity Tribute went offline in the 0000EST Monday interval, then operated at various intervals throughout the week. The 80MW capacity Trevallyn operated at various times after going offline in the 0230EST Monday interval. The 60MW capacity Devil’s Gate quit in the 0030EST Saturday interval. The 125MW capacity Tungatinah was offline in the intervals between 1900EST Wednesday and 1500EST Thursday. The 200MW capacity Poatina 220 operated briefly on Wednesday and Thursday. The 120MW capacity Bell Bay 2, the three 35MW capacity Bell Bay Three units, the 64.75MW capacity Woolnorth, the 32.4MW capacity Lake Echo, the 28MW capacity Repulse, the 28MW capacity Paloona, the 17MW capacity Cluny and the 14.4MW capacity Butler’s Gorge were offline all week.
Interconnector flows: The Victoria-South Australia Heywood interconnector averaged 8.86MW east, down 84.0 per cent on the average 55.50MW east the previous week. Murraylink averaged 32.42MW east, up 9.9 per cent on the average 29.49MW east the previous week. Vic-Snowy exports averaged 226MW, down 51.4 per cent on average exports of 465MW the previous week. Snowy-NSW exports averaged 230MW, down 54.5 per cent on average exports of 505MW the previous week. QNI averaged 9.30MW south, compared to an average 105MW north the previous week. Terranora averaged 23.51MW south, up 859.6 per cent on the average 2.45MW south the previous week. Basslink averaged 54.52MW south, compared to an average 1.10MW north the previous week.
Erisk Net, 15/10/2007

Leave a comment